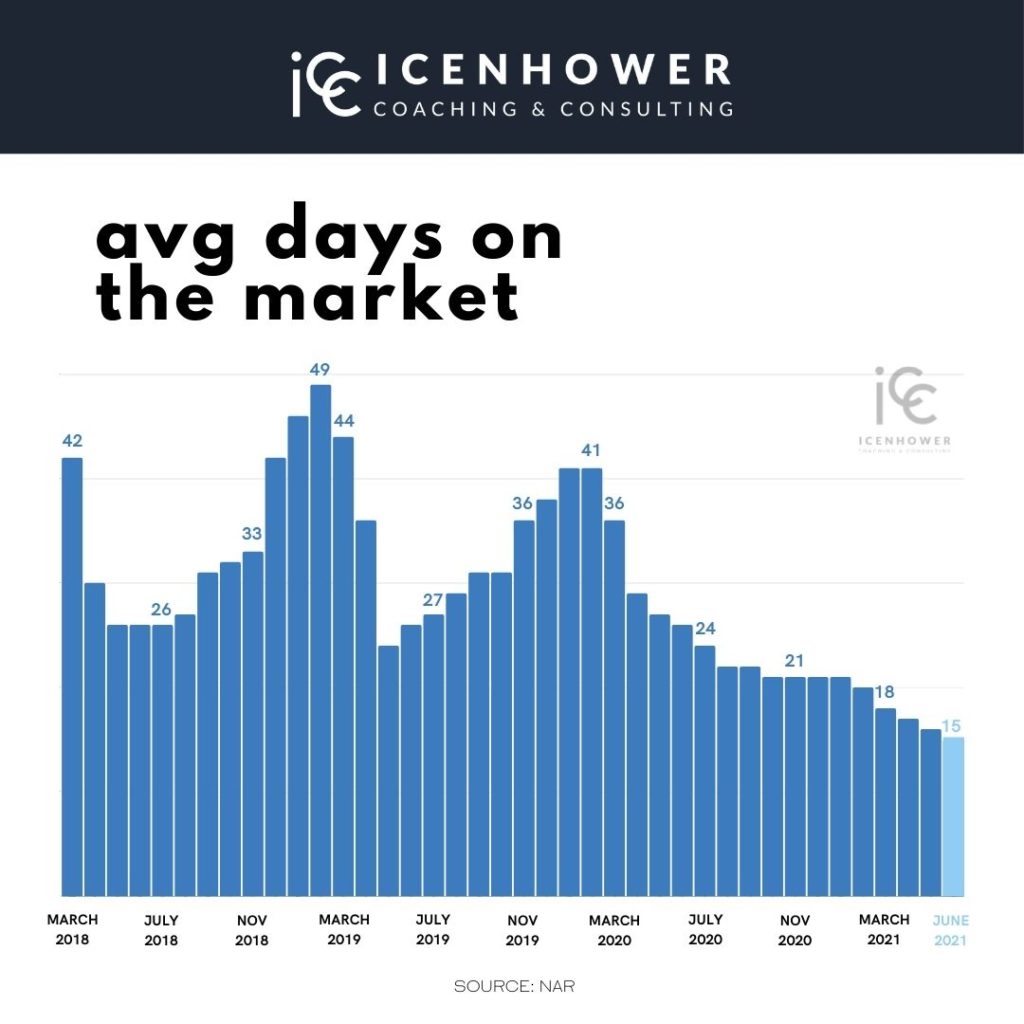
Download and share this Average Days on Market 2021 Social Media Infographic to set proper home buyer expectations to write aggressive offers to purchase.
Share this with your people: Average Days on Market 2021 infographic. At ICC, we preach the concept, “Don’t just tell them, SHOW them.” Helpful infographics that back up your talking points to your clients will immensely help your buyer and listing presentations.
VIDEO: Average Days on Market 2021 – Social Media Infographic
That summer lull — what does it mean?
This happens every year around this time. In June and July, it is common for the real estate industry to experience a bit of a “lull,” and this occurs for a number of reasons. The biggest reason? It’s summer vacation for most families. Everyone wants to travels. This year is no different — in fact, it is even more exaggerated than in years past. We weren’t able to travel much at all during the worst of the Covid-19 pandemic. As a result, the travel industry is now seeing a huge spike in sales. People are getting out and about even more than in years past because they’ve been so cooped up!
Because of this, many Realtors freak out. Why has my listing been on the market for four days?! Is the market slowing down?! Are prices coming down?! Nope. Hold your horses. This is normal, and the market is as hot as it has ever been. We have seen home values appreciate at a rate of about 7% each year for the past ten years, which is phenomenal. Throughout that period, there were many times when people may have felt like the market was slowing and prices were going to start to go down. It didn’t happen then and it’s not happening now. This is not a housing bubble and it’s not about to burst. If you take a look at the chart below, Average Days on Market 2021, you’ll see that even with this “slow down” you may feel, houses are still, on average, flying off the market.
You must keep your eye always on supply and demand. That is all that matters. Supply and demand drives the economy. This is why this Average Days on Market 2021 infographic is so valuable. It helps show that despite that “lull” you feel during the summer, houses are still being sold so quickly. Inventory is low and the demand for houses is higher than ever.
Average Days on Market 2021 – Social Media Infographic
The graph below is proof that the housing market is hot. It isn’t slowing down, it’s speeding up. In March of 2020 when the Covid-19 pandemic took hold of the country, we can see that despite that, houses continued to sell and sell quickly. Now that the country is back open again, it hasn’t slowed, it has sped up.
Showing buyers this chart will help create urgency. Buyers will often use the objection that they want to wait until the market is “better.” You can show your buyers this Average Days on Market 2021 infographic to demonstrate that now is the best time to buy. It’s only going to get worse, we project, for the next several years at the very least. Supply is at an all-time low, and it would take a very long time to get it to a balanced place!
Prices have gone up nearly 20% since the beginning of the pandemic. That is appreciation like we have never seen. Anyone that thinks there is a downturn in their market needs to realize that there is no real “lull.” You can help buyers see the reality with helpful graphics like this. Download and share this infographic during your buyer presentation.
Learn more about ICC
- Join the Real Estate Agent Round Table. We are always posting fresh content, including market updates, free templates, and host dynamic discussions with the industry’s top producers.
- Subscribe to our newsletter. In the sidebar of this blog, you’ll see a form to fill out to subscribe. You’ll be the first to find out about our new resources, free downloads, premium online courses, as well as promotions.
- Reach out and talk to an ICC coach. Not sure which of our coaching programs is right for you? Let us help you.

Check out our latest posts:
- Are Real Estate Teams Dying Off? How the Strong Survive
- Your CRM Holds the Next 6 Months of Your Real Estate Income — Here’s How AI Unlocks It
- How to Determine the Best Real Estate Agent Lead Generation Methods for Different Types of Agents
- How Real Estate Agents Can Finally Win With Money in 2026
- The Icenhower 2026 Real Estate Sales Outlook for Agents


