
Learn these listing scripts for real estate agents to motivate clients who need more confidence before listing and purchasing a new home in a low-inventory housing market.
Listing scripts for real estate agents have never been in higher demand. Why? Because inventory is low and it is a seller’s market, making it arguably the best time to sell. To get your clients on your side, you’ll need all the tips, tricks, and scripts you can get your hands on. In this case, we are giving you talking points and helpful graphics that you can share with your clients.
VIDEO: Listing Scripts for Real Estate Agents to Create Urgency
Why is waiting a bad idea?
Prices are rising. Interest rates are rising. Clients are complaining that there is no inventory. Many want to “wait it out” to list when interest rates and/or prices “come down.”
Waiting is the worst thing a seller could do right now. You’ll need real estate listing scripts to help convince your clients otherwise.
It’s very normal for sellers to not want to sell their home right now as interest rates rise. Think about it. They’re locked in at a nice low rate on their current home. Why would they give that up to buy a new home with a higher rate?
Waiting feeds into the problem. When sellers decide to stay put and not list their house, that reduces an already low housing supply. And when housing supply goes down without any change to demand, prices will continue to climb — fast. So, the increased interest rates do cause prices to increase in this way.
We can look to historical data to see the numbers that back me up.
Listing scripts for real estate agents
As I say often, SHOW, don’t just tell. Today I’m going to walk you through several of our latest and greatest infographics that demonstrate valuable talking points between you and your sellers.
Rising Rates = Rising Home Prices infographic
As interest rates climb, home prices climb (sometimes, even faster). If your seller thinks that waiting a while will allow the high interest rates to bring down home prices, show them that history proves otherwise.
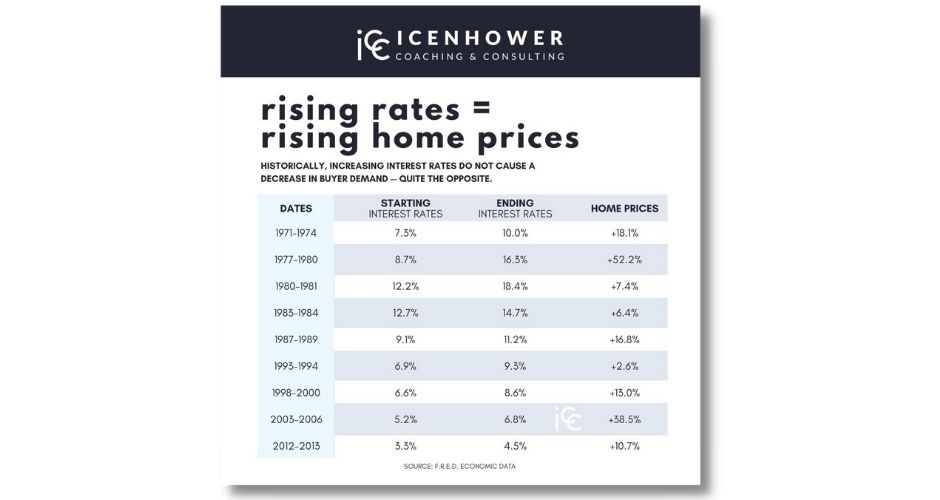
If you want to learn more about the effect that mortgage rate increases have on price, be sure to read this blog.
Average 30-Year Mortgage Rates infographic
The average rate during the 1980s was around 12-13%. You can see on the graph the extreme volatility during those years — lots of jumping up and down. Despite the high interest rates, the 80s were a prosperous time.
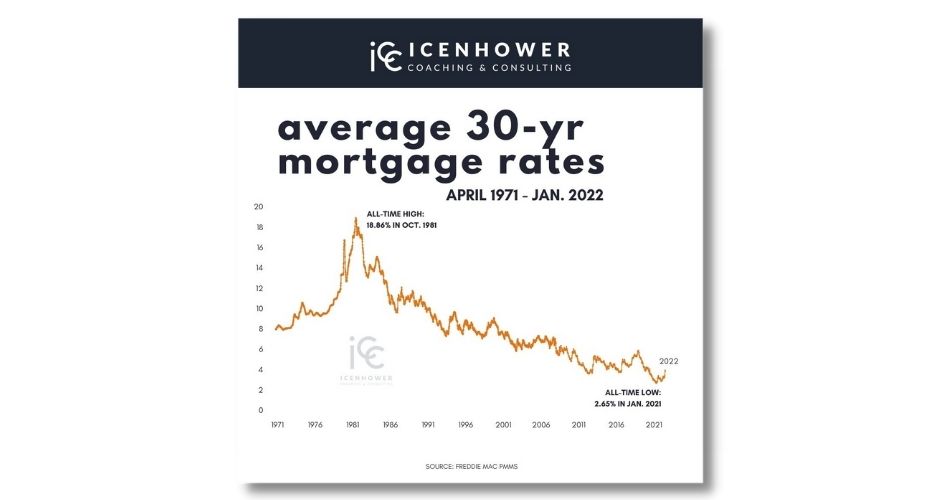
Waiting around is extremely dangerous. You can always refinance later! Prices will continue to go up. When a recession comes along, all you need to do is sit tight for a few years and you’ll be fine.
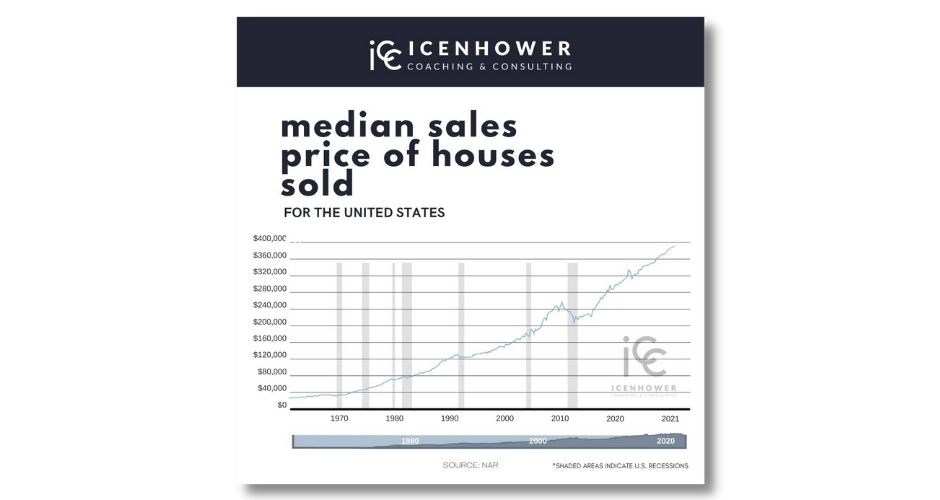
Median Sales Price of Houses Sold infographic
As you go through your listing scripts for real estate agents, this is another great graph to share. It shows how sales prices have continually risen throughout the past 60 years. You can see the blip where prices went down — that was a recession. You can also see that prices quickly recovered and started to rise again a few years later.
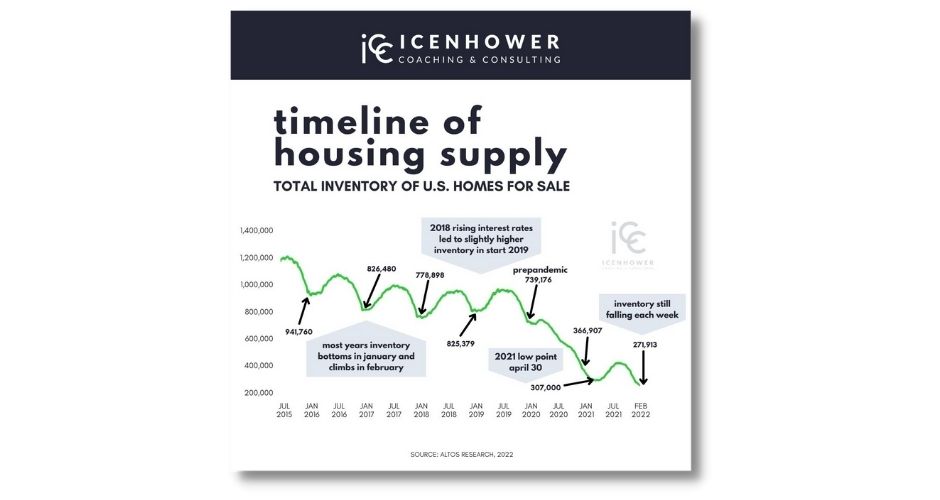
Timeline of Housing Supply infographic
Supply and demand drives home prices and values. In this chart, you can see the supply timeline going back to 2017. You can see that it slowly drops each year. Then boom, the pandemic hits, and we drop super low, and quickly. A few years later and we are back to a more regular pattern, but we are still low on supply and continuing to trend downward.
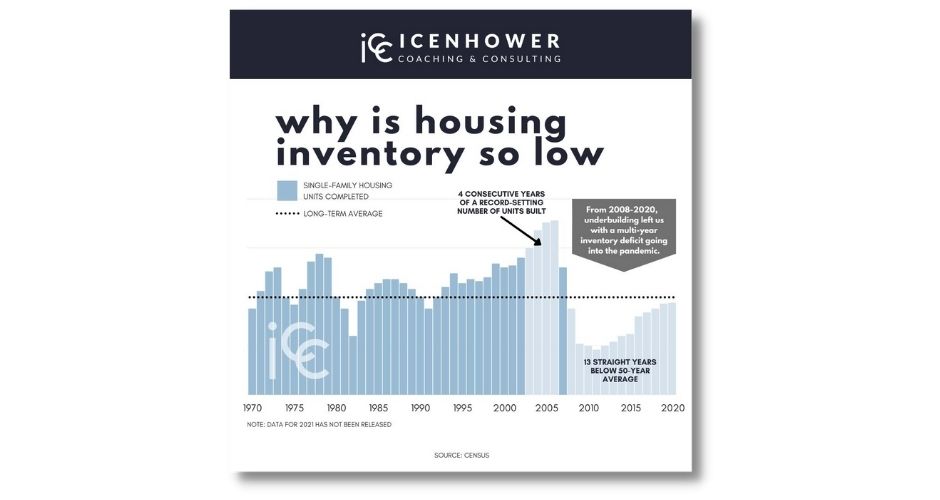
Why is Housing Inventory So Low? infographic
If we look at this chart, we can see how many houses were built in America based on the U.S. Census. This is one of the best listing presentation scripts for real estate agents to share in order to show why supply is so low. When the recession hit, you can see that housing inventory dropped. Houses weren’t being built at the same level as before the recession. Ever since then, we’ve been behind. We simply don’t have enough housing supply to meet demand.
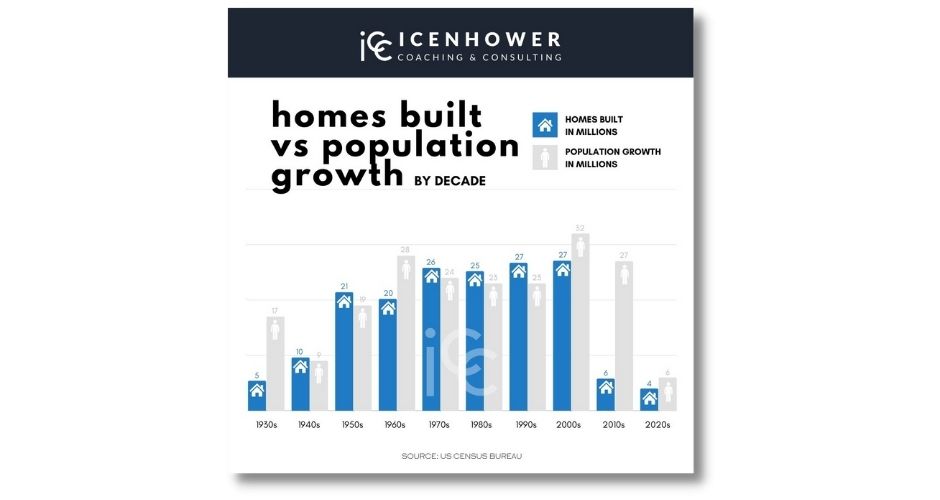
Homes Built vs Population Growth infographic
This is another great chart that shows you how many homes were built in each decade vs population growth. From 2010-2020, you can clearly see a severe discrepancy.
Listing scripts for real estate agents: BUY ASAP
Here are a few important points that you can use as listing scripts for real estate agents. These are simple urgency objection handlers.
- You can always refinance your mortgage rate. However, you can not “refinance” the price of your home.
- The sooner you can buy (and sell) the better. Prices are projected to continue to increase with no *clear* end in sight.
- You can’t buy until your home is listed or under contract. Nobody is accepting offers with contingencies in today’s hot seller’s market.
- You can set up a contingency to protect yourself and ensure that you find a replacement home before closing.
A tale of two “markets”
There are two “real estate markets” that the public talks about. You need to know the difference between the two.
- Housing prices going up or down is usually what the general public is talking about when they reference the “real estate market.” This “market” matters most to clients and the public. A “hot market” means prices are going up. A “cold market” means prices are dropping. As agents, we don’t care much about this “market” because people will be buying houses either way and it doesn’t really affect our livelihood.
- Sales volume is the “real estate market” that affects real estate professionals. Prices can still go up if there aren’t any sales. If there aren’t any sales, that means there aren’t many listings. If there aren’t many listings, that means agents are making less money. This can happen, though it doesn’t happen a lot. If sales volume decreases, real estate agents’ profit margins go down.
Listing scripts for real estate agents to educate clients
You must be knowledgeable enough about both of these “real estate markets” to sort through the media hype and educate your clients on what is real and what is clickbait. If you are more knowledgeable than the public on the housing market, you will bring value to your clients.
When you see media outlets sharing stories about the “real estate market cooling,” understand which “market” they are talking about. Right now, neither of these “markets” are cooling. But, you will see outlets saying otherwise. They are saying these things because March 2022 pending sales dropped .05% over March 2021 pending sales. To the everyday person that doesn’t know the facts, a headline like this sends the wrong message.
You must understand that March 2021 had more pending sales than any March in the history of this country by a long shot. March 2022 was off by .05%. That’s a really close “second place” to the best March in our history. So yes, technically the market has “cooled” but if you understand the entire picture, you’ll know that this media headline is misleading.
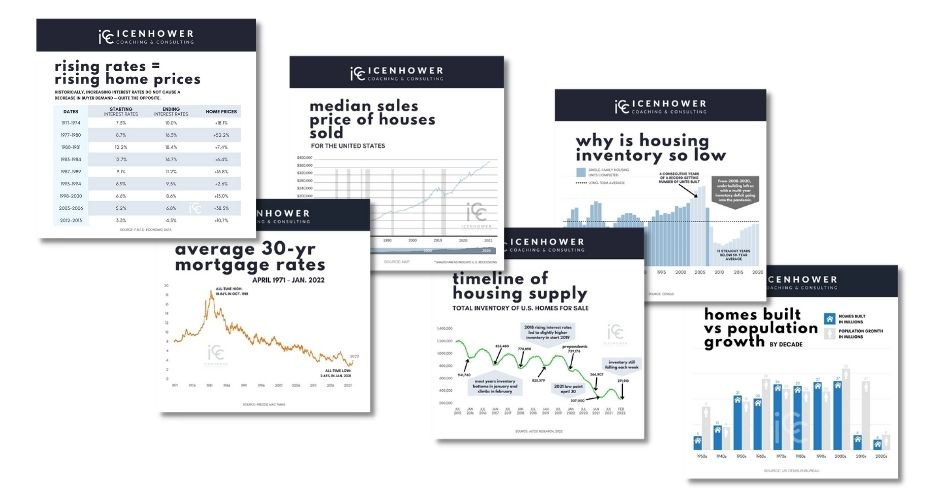
FREE DOWNLOAD: Market Infographics Package
Today we’re giving you the high-resolution version of every helpful infographic that we mentioned in this blog. Share these graphics with your clients! Remember, SHOW, don’t just tell. There is power behind sharing your knowledge and backing it up with visuals that prove your expertise.
Want to learn more?
- Read The High-Performing Real Estate Team. You can buy Brian Icenhower’s best-selling book on Amazon.
- Subscribe to The Real Estate Trainer Podcast. You can find it on Apple Podcasts, Google Podcasts, Spotify, Podbean, and anywhere you listen to your favorite podcasts.
- Join the Real Estate Agent Round Table. We are always posting fresh content — everything from market updates to free templates — and host dynamic discussions with the industry’s top producers.
- Subscribe to our newsletter. In the sidebar of this blog, you’ll see a subscription sign-up form. You’ll be the first to find out about our new resources, free downloads, premium online courses, and the latest promotions.
- Reach out and talk to an ICC coach. Not sure which of our coaching programs is right for you? Let us help you.