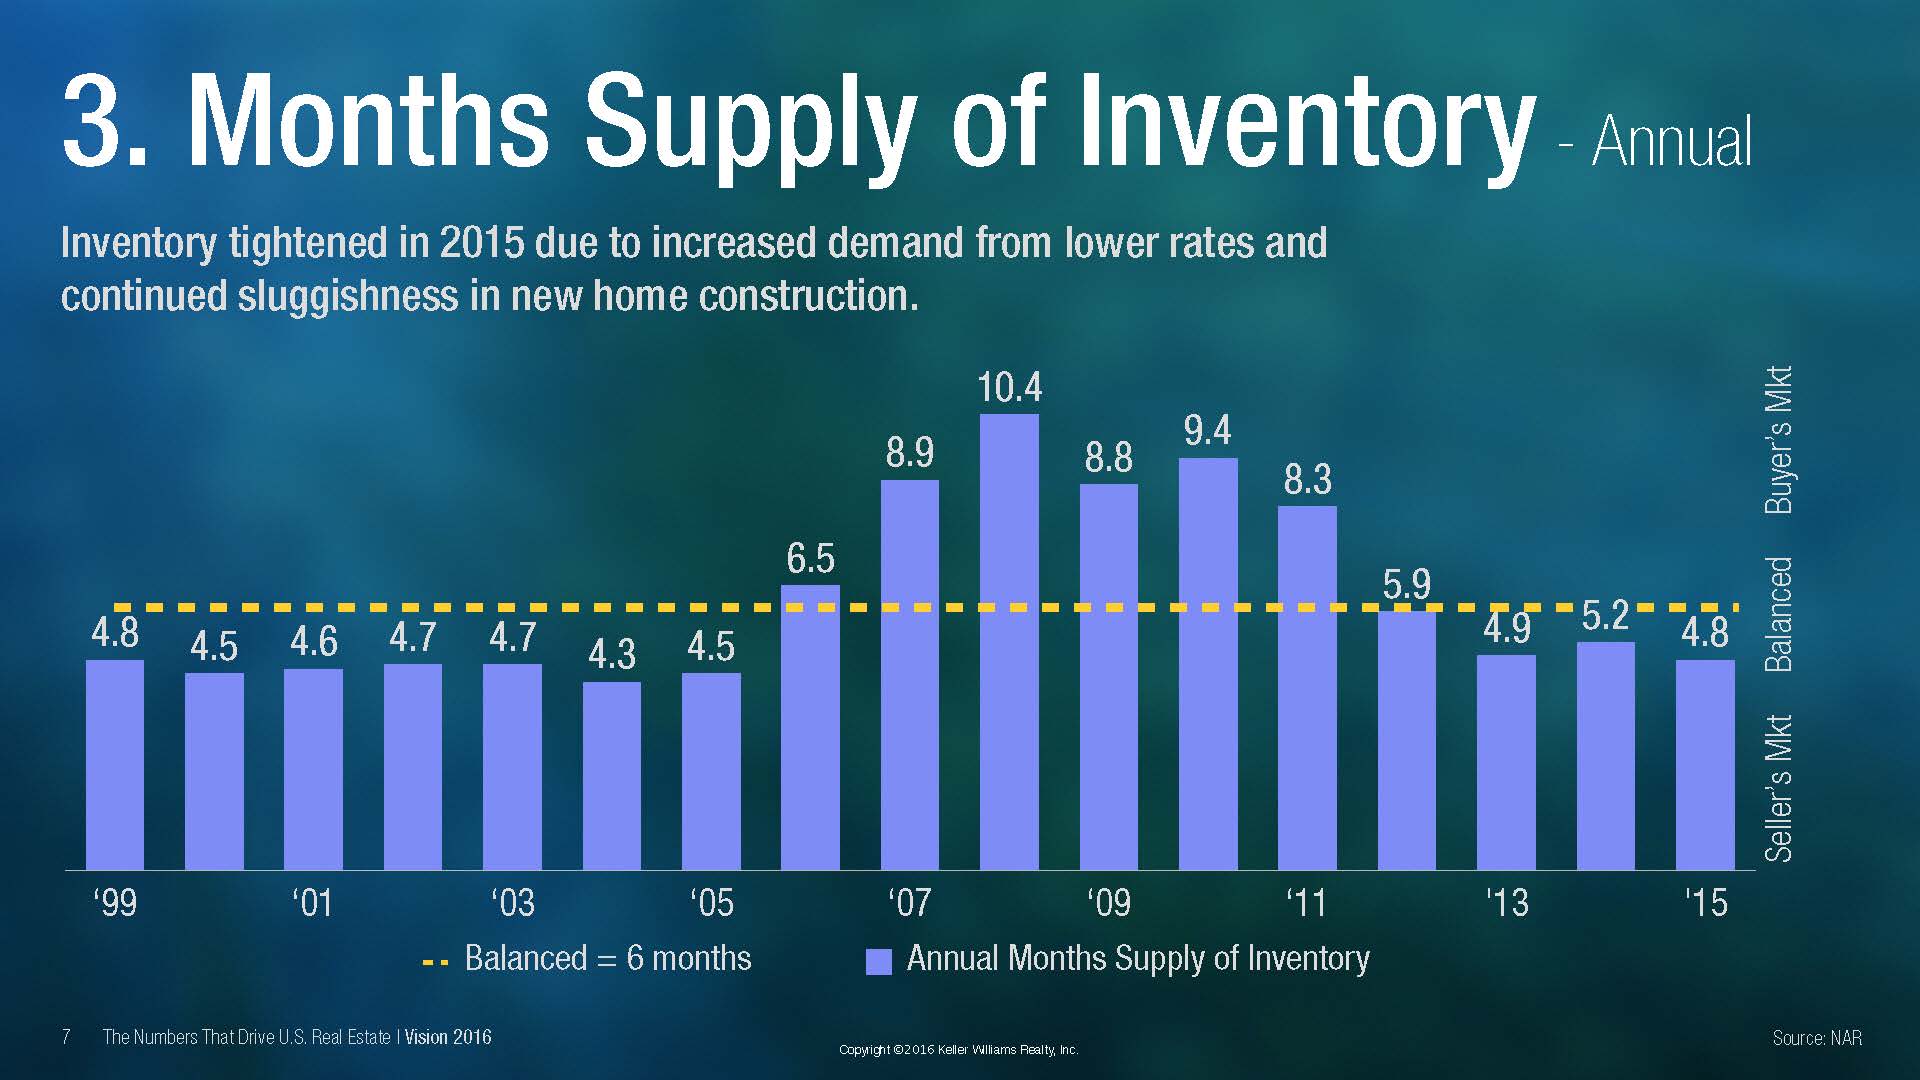
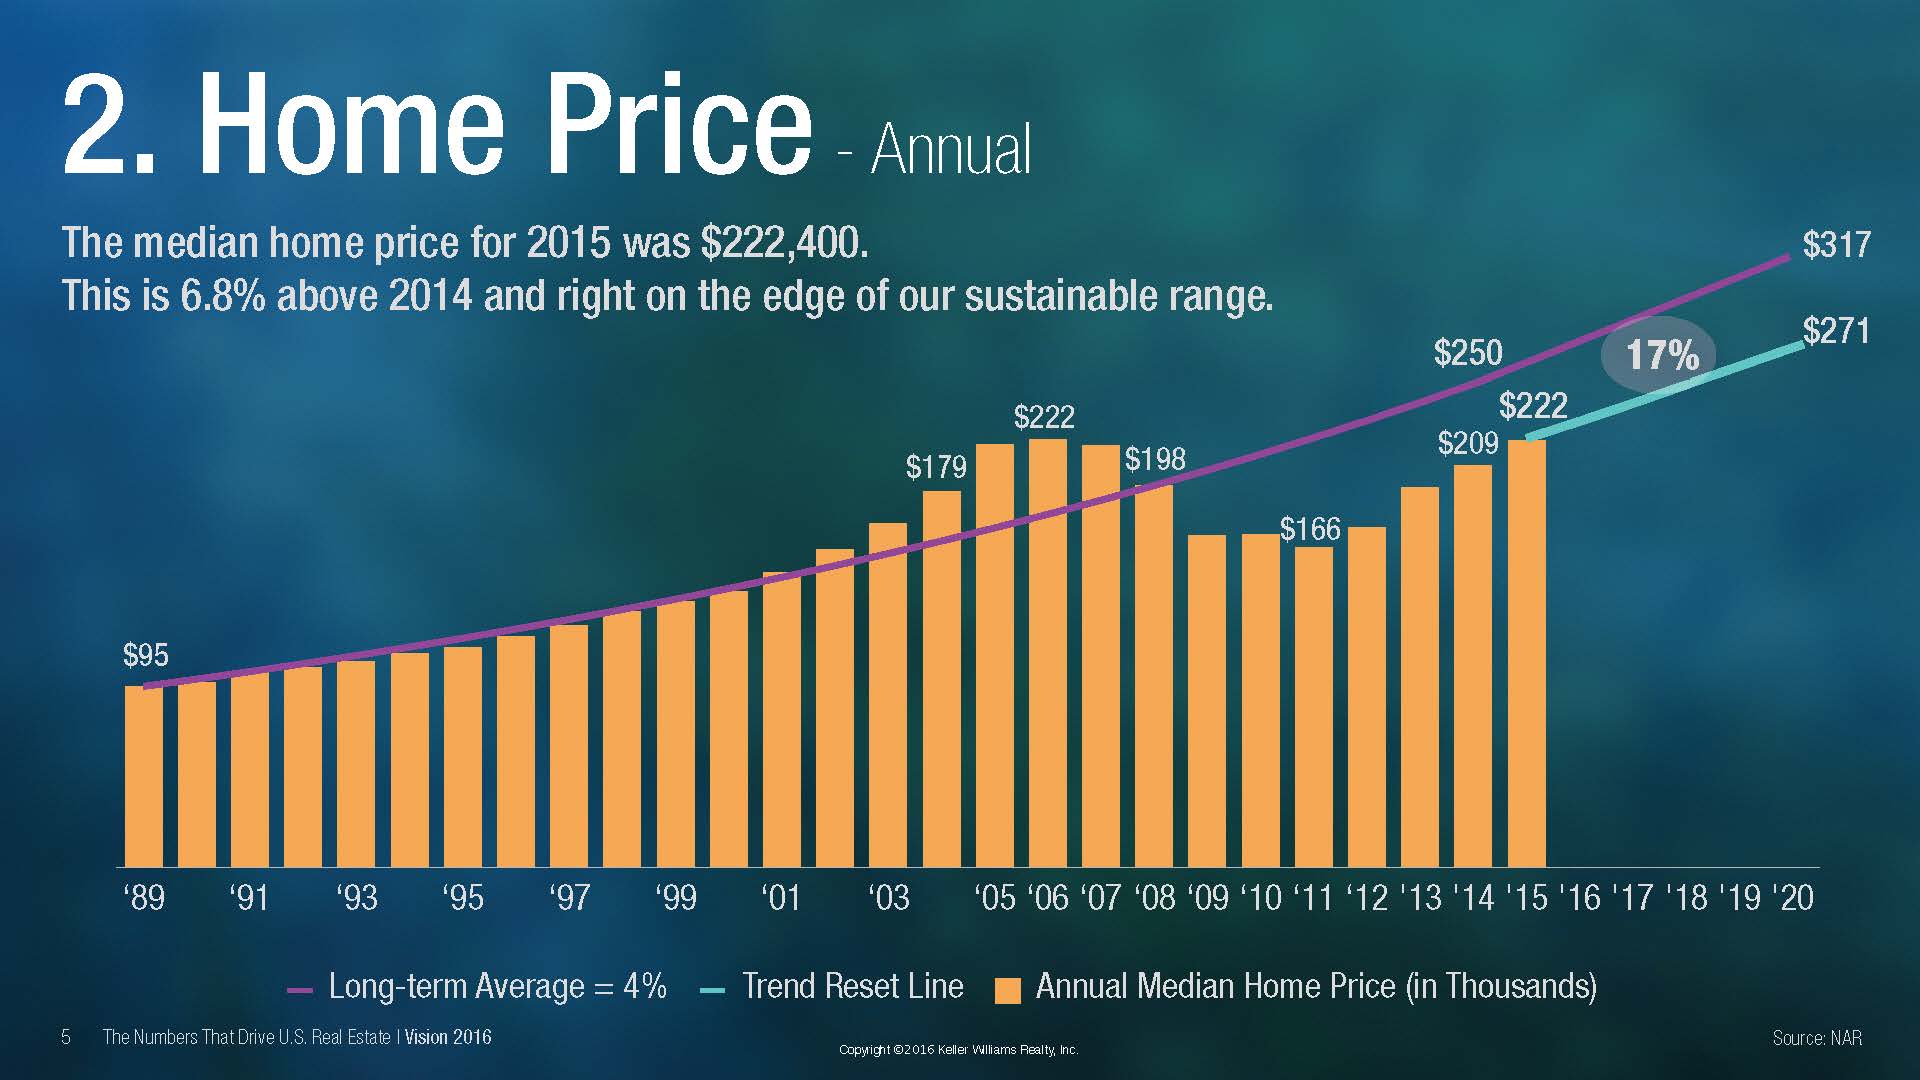
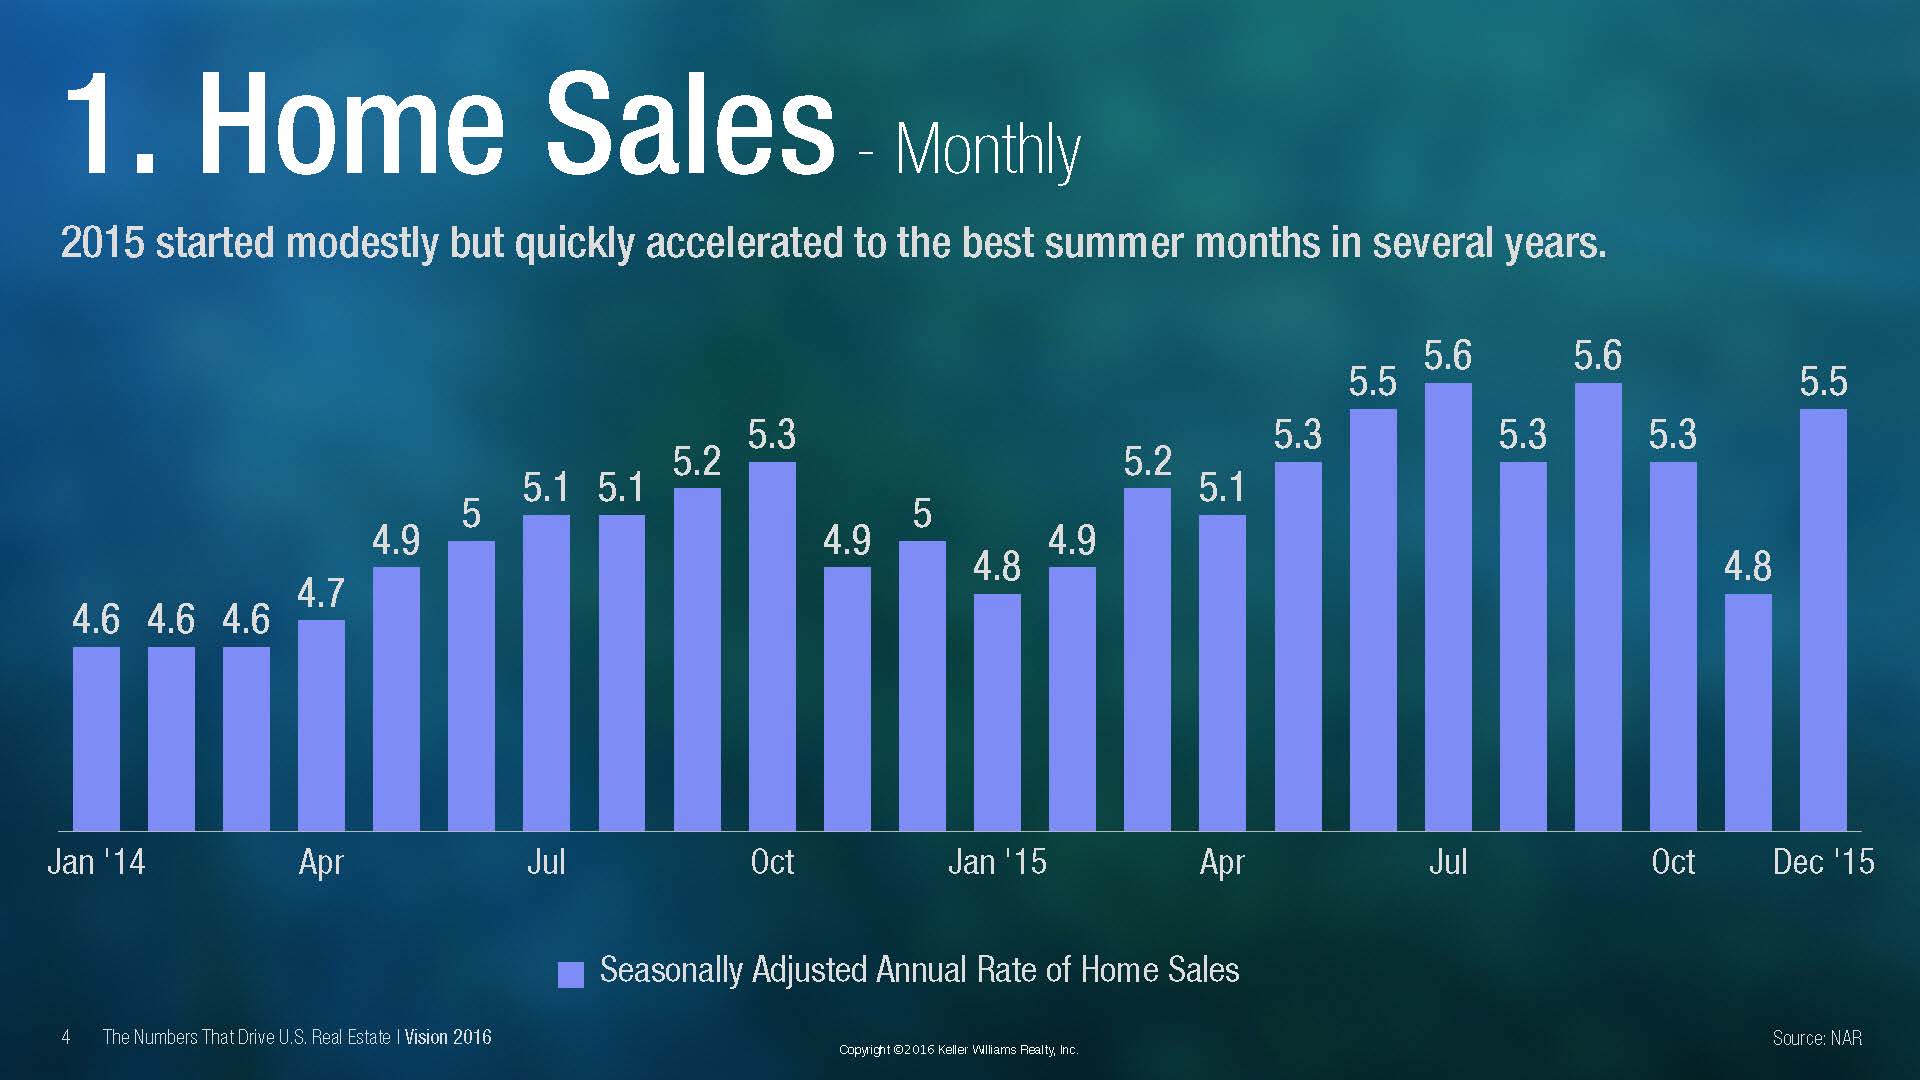
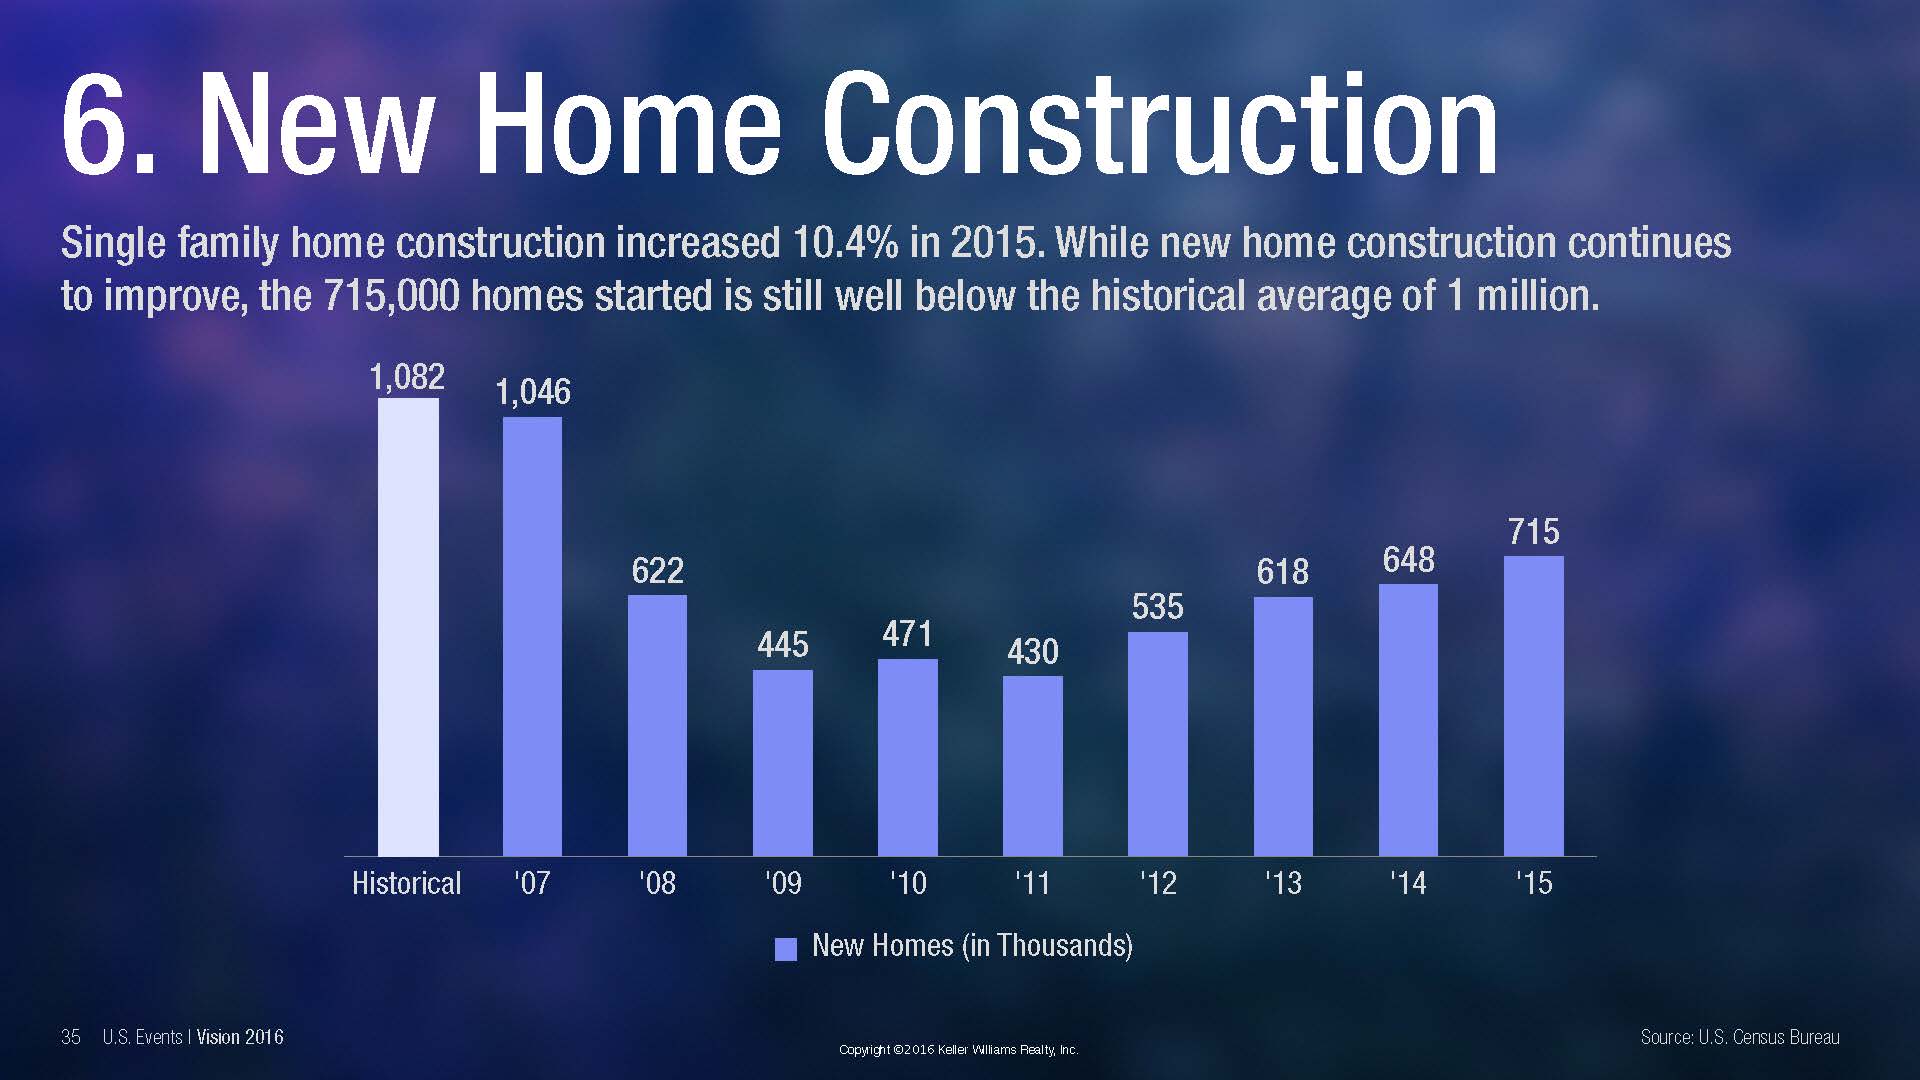
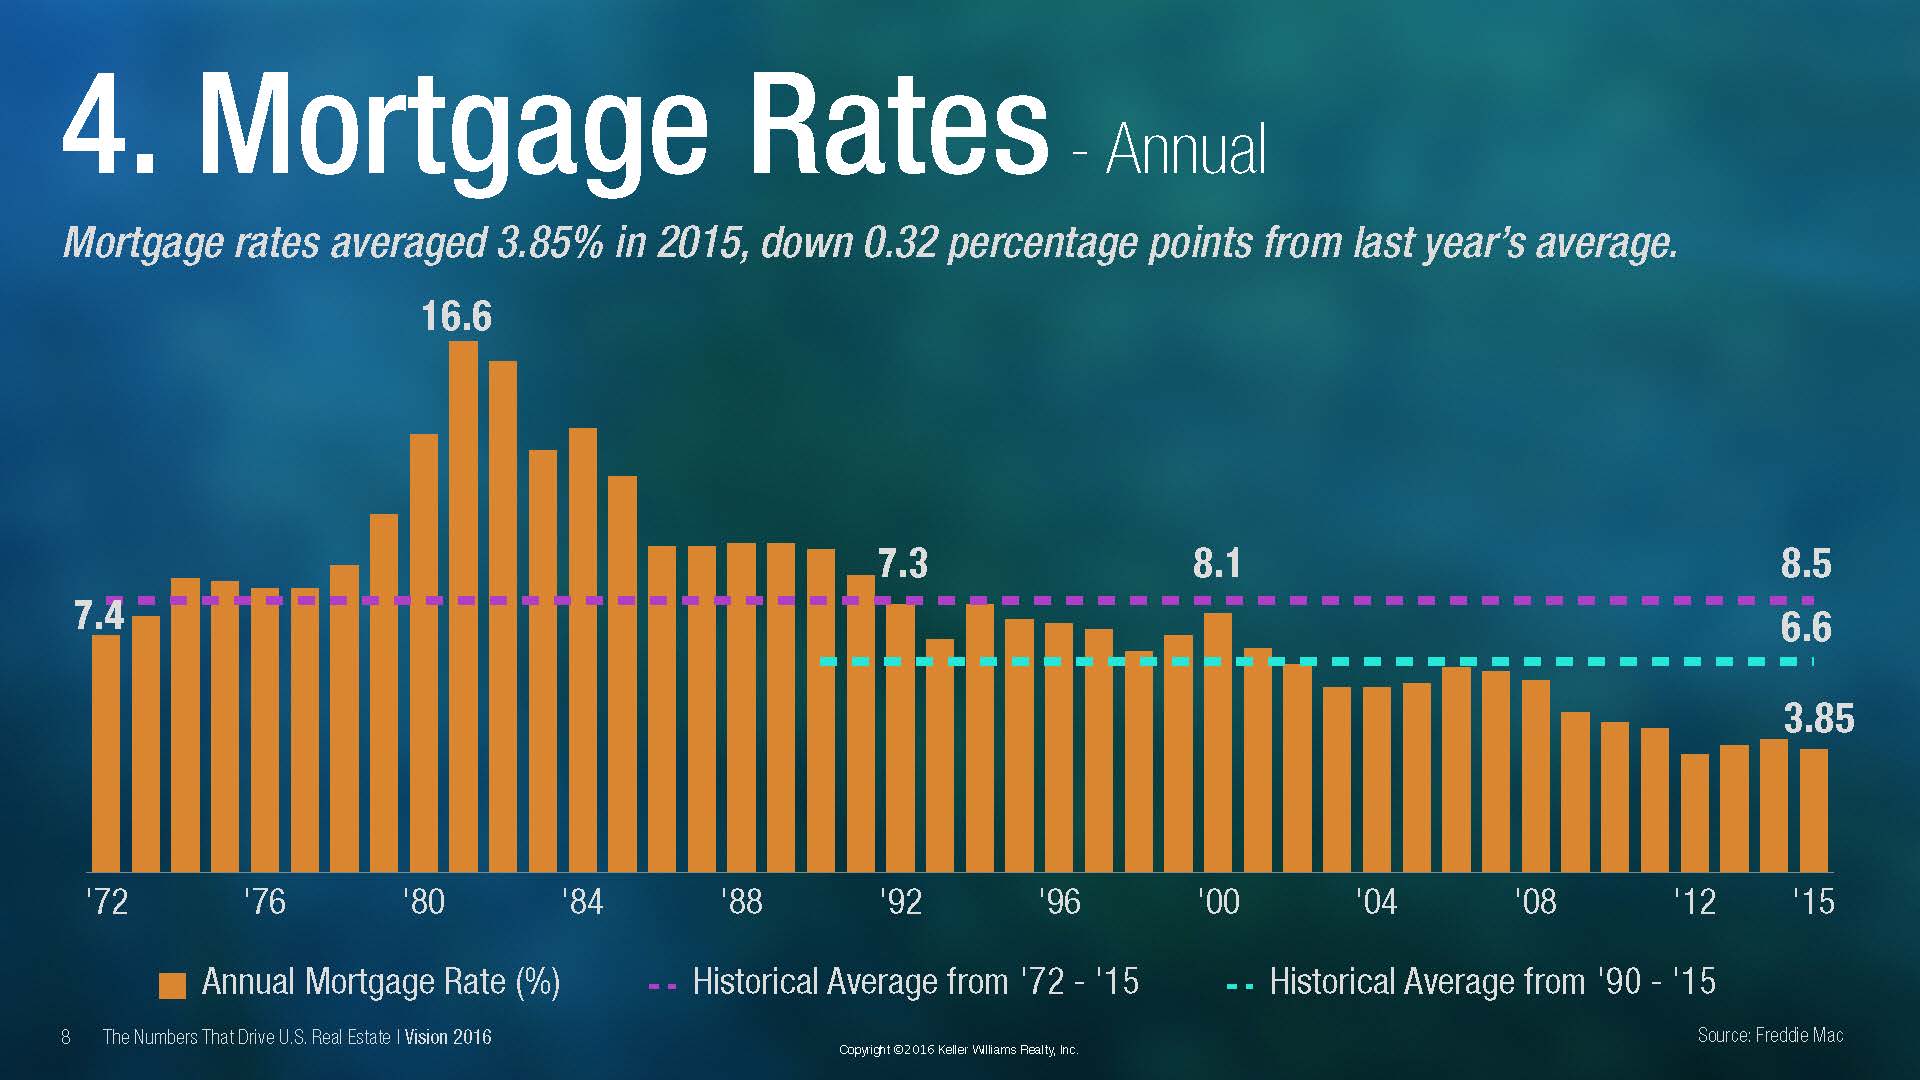
Use these infographics to inform clients about the current real estate market and housing market trends & statistics to help them make informed decisions about the purchase and sale of their property. Use these real estate infographics to show how home price appreciation is expected to trend upward, how the month’s supply of housing inventory impacts buyer purchasing power, how existing home sales have steadily increased over the past year, how new home construction starts are picking up momentum, and how mortgage interest rates are steadily rising again. This data can impact decisions regarding when and how clients purchase or sell real estate, so be sure to use due diligence and provide them with this material information to allow clients to make informed decisions before making their next move.
Real Estate Market Update: Housing Price Trends
Real Estate Market Update: Housing Inventory
Real Estate Market Update: Home Sales
Real Estate Market Update: New Home Construction Sales
Real Estate Market Update: Mortgage Interest Rates
All infographics provided courtesy of Keller Williams Realty & the KW Blog
Listing Presentation Scripts & Dialogues
Top 10 Real Estate Farming Ideas
Lead Follow Up Scripts & Methods
Ways to Grow a Real Estate COI Quickly
Inside Sales Agents on Real Estate Teams
REALTOR Database Contact Plans & Scripts
Realtor Vendor Databases: Scripts & Lists to Build Them
The One Page Real Estate Business Plan
A Real Estate Administrative Assistant’s Job Description
FSBO Prospecting Scripts & Objection Handlers
Open House Scripts to Generate New Listings
Scripts for Buyers: How to Show Less Homes
Just Listed & Just Sold Real Estate Scripts
What to Say When Calling FSBO Sellers for Listings
Managing & Compensating Buyers Agents on Real Estate Teams
Easy Ways to Ask Your Clients for Referrals


