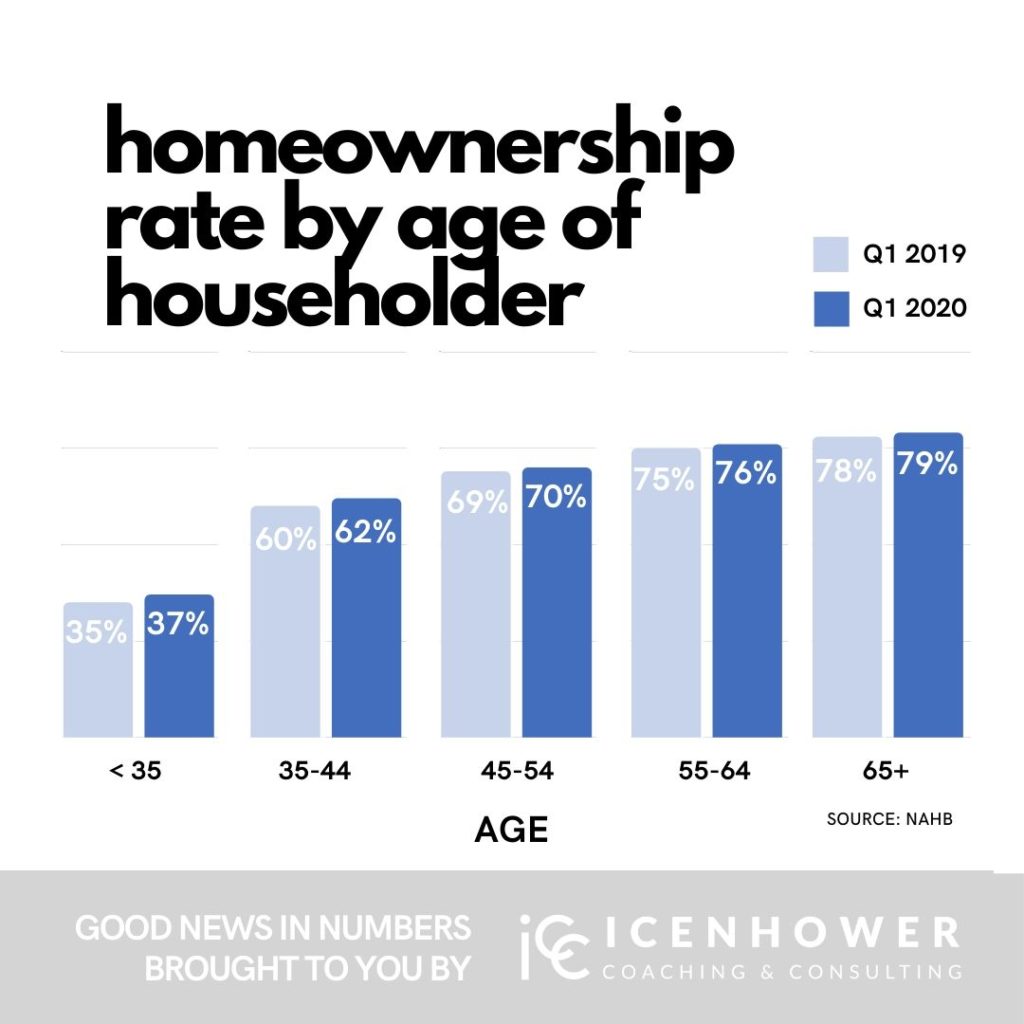
Infographic by Icenhower Coaching and Consulting that demonstrates the homeownership rate by age of householder
This infographic sheds light on homeownership rate for different age groups. It might help explain why home buyer demand has remained so strong despite more than 40 million people losing their jobs. According to the National Association of REALTORS, only 65% of Americans can afford to purchase a home. So, could it be that the majority of the recently unemployed were younger in age and could not yet afford to buy a home anyway? It’s worth speculation.

Share with your clients
Infographics, like the one above on homeowner rate by age, are important. Not only important for those of us in the real estate industry, but also for our clients. Please feel free to copy and share the above information! Download and share the infographic itself with your followers on social media. Keeping your SOI in the loop is a great way to provide education to your clients on the current market. Facts will always be a good way to reassure your clients during confusing times. Remind them that you are willing and able to help them buy and sell real estate — even now.
For more helpful infographics
If you like our “Homeownership Rate by Age of Householder” infographic, you’re in luck. We’ve got a lot more where that came from! Our Facebook group, Real Estate Agent Round Table, is the top Facebook group for real estate agents. We are sharing helpful infographics like this all the time, as well as tips on how to use them as talking points with your SOI. Beyond helpful infographics, we also host live webinars, post helpful resources, and provide free downloadable materials to our group members. Join the conversation today!

Check out our latest posts:
- Are Real Estate Teams Dying Off? How the Strong Survive
- Your CRM Holds the Next 6 Months of Your Real Estate Income — Here’s How AI Unlocks It
- How to Determine the Best Real Estate Agent Lead Generation Methods for Different Types of Agents
- How Real Estate Agents Can Finally Win With Money in 2026
- The Icenhower 2026 Real Estate Sales Outlook for Agents


