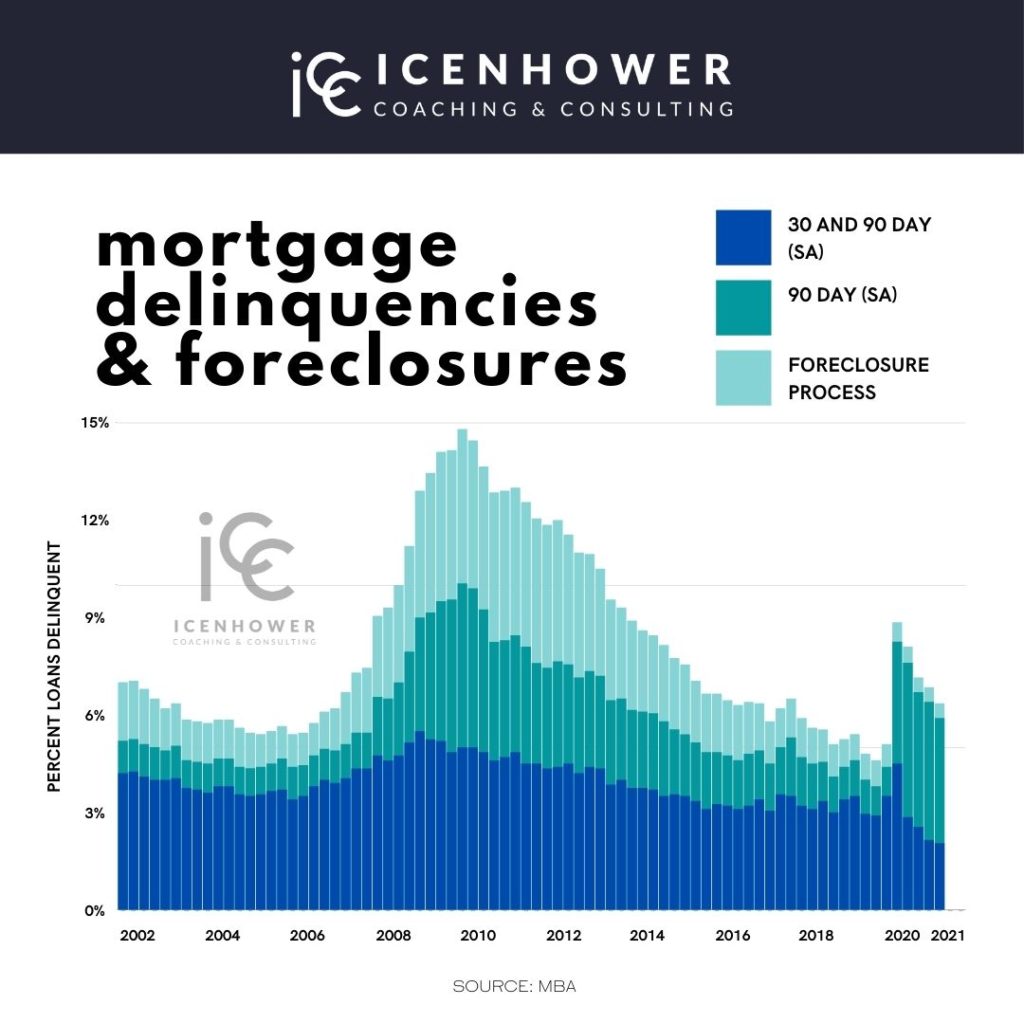
Use this mortgage loan delinquency rates 2021 chart to show how home loans that have been in deferment or forbearance during the Covid-19 pandemic are gradually decreasing and are avoiding foreclosure.
Today, we are giving you this Mortgage Loan Delinquency Rates 2021 Chart. This helpful chart can be used to educate clients on the current market and help combat their objections to buying or selling now. Infographics like this one can help you show, and not just tell, your clients about the current market. Let’s talk more about what exactly this chart means, and how to use it with your clients.
VIDEO: Mortgage Loan Delinquency Rates 2021 Chart
Use this chart to handle this common objection
This Mortgage Loan Delinquency Rates 2021 Chart is helpful for talking to clients that want to wait to buy or sell. The common objection here goes something like this, “I know the market it hot. But, I want to wait until all those mortgage delinquencies from the Covid-19 deferments hit the market. And when those houses hit the market — that is when I am going to buy real estate.”
Unfortunately, that’s just not going to happen. In the chart below, we have numbers dating back to 2002. In the 2010 era, you can see that we had record numbers of foreclosures in the United States. The lightest blue shows you the number of people who are in the foreclosure process. Next, you can see in the medium shade of blue represents people who are 90 days delinquent. The darkest blue is people who are 30-90 days delinquent. Even in the hottest market during the housing boom, you can see a fair amount of this darkest blue. It is common for people to simply miss a mortgage payment, for a number of reasons.
The chart is trending down
Now, we can see that halfway into 2021, the level of 30-90 days delinquent payments is the lowest that it has ever been. However, you can also see that there are a lot of people in the 90-day delinquent zone. This freaks people out. But, you can see that number is declining as well. Notice how almost nobody is going into the foreclosure process. The Mortgage Loan Delinquency Rate 2021 Chart is trending down. Yes, there are a lot of people in deferment, taking a free ride, but people aren’t getting foreclosed upon. So, why is that?
The simple answer is that the market is hot and people have equity in their homes. It would make a whole lot more sense to sell your home to pay off the bank loan than to go into foreclosure. In this scenario, the seller would possibly make some profit in the process as well! The market is that hot.
We have seen appreciation in this past year between 15-20%. That is going to be more than enough to make up a year of loan payments and then put a bunch of money in your pocket. That’s why people going into the foreclosure process is simply not going to trend up. People have too much equity in their homes, and the market is too hot.
Be sure to watch the video in this blog for a more complete walkthrough and explanation of the Mortgage Loan Delinquency Rates 2021 Chart.
Download the Mortgage Loan Delinquency Rates 2021 Chart
Let’s sum this up. Virtually no one is having an issue getting out of forbearance. There is no detectable change in the number of foreclosures as this is happening. Please download and share this chart with your clients!
Learn more about ICC
- Join the Real Estate Agent Round Table. We are always posting fresh content, including market updates, free templates, and host dynamic discussions with the industry’s top producers.
- Subscribe to our newsletter. In the sidebar of this blog, you’ll see a form to fill out to subscribe. You’ll be the first to find out about our new resources, free downloads, premium online courses, as well as promotions.
- Reach out and talk to an ICC coach. Not sure which of our coaching programs is right for you? Let us help you.

Check out our latest posts:
- Are Real Estate Teams Dying Off? How the Strong Survive
- Your CRM Holds the Next 6 Months of Your Real Estate Income — Here’s How AI Unlocks It
- How to Determine the Best Real Estate Agent Lead Generation Methods for Different Types of Agents
- How Real Estate Agents Can Finally Win With Money in 2026
- The Icenhower 2026 Real Estate Sales Outlook for Agents


