In Brian’s 2021 Real Estate Market Forecast discover Icenhower Coaching’s predictions for annual home appreciation, housing inventory and sales volume for 2021.
I get this question all the time: “What is your 2021 real estate market forecast?” At ICC, we have compiled the data and in looking at the current trends and information from years past, we’ve generated a number of insights to share with you. Please feel free to copy/share the infographics from this blog post!
VIDEO: 2021 Real Estate Market Forecast
Annual Home Sales, 2021 real estate market forecast
From 2003-2005, we saw one of the sharpest increases in total sales volume. Take a look at the graphic below. We got to a point where we had 6.2 million in sales volume. As real estate agents, we get paid as a percentage of sales volume. So that increase in sales means commissions are going up, too. If you weren’t a Realtor back in the early 2000’s, you are still a rookie today. You haven’t completed a full cycle yet. Back then, it felt like there were no listings and no inventory. But you can see the proof in the data below. There were more than 1 million more listings back in the early 2000’s than in the past four years! The buyer demand was so high that houses were selling like hotcakes. We’re seeing the same thing happen in the housing market today.
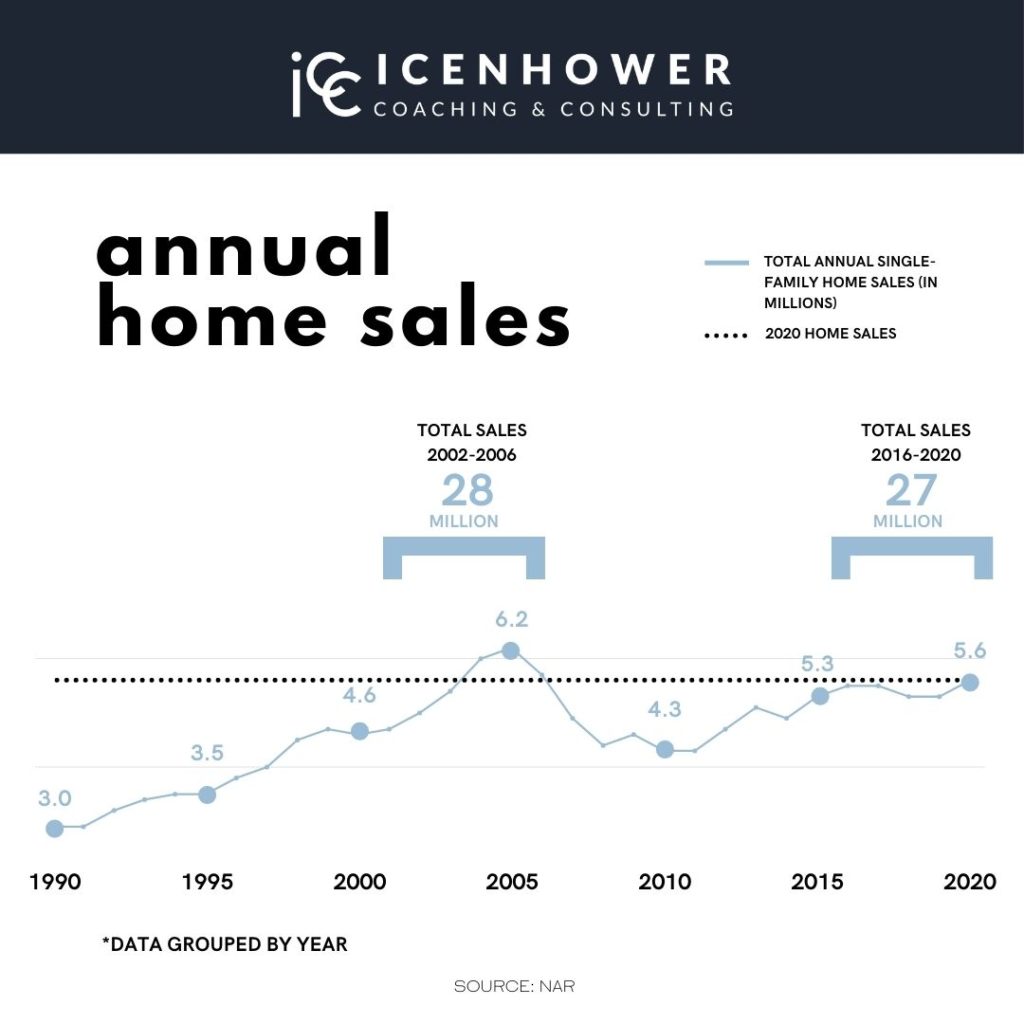
Sales volume has been creeping back up. Right now, it is to about 5.7 million in the first quarter of 2021. It’s picking up speed and you can feel it. We’ve never had, in this country, more listings hit the market in January and February. It doesn’t feel like it because they are selling so quickly with multiple offers, but it’s true! You can see that history is repeating itself here from what happened in 2003-2005. This is the cycle! Every economic signal is telling us that we are headed toward a peak again.
In this 2021 real estate market forecast, I’m telling you that we are not low on listings. Clearly, our sales volume is going up. It’s increasing from years past. It’s important to keep everything in perspective, and these infographics will hopefully help you see that. This is not a hard time for real estate agents! This is the hottest market you could have. You have two years to get as much as you can because it’s never going to be easier than right now.
Housing Inventory, 2021 real estate market forecast
Look at our housing inventory (see graphic below). We talked about the housing boom in 2004 and 2005. We were down to 4.3 months of inventory. That was when we saw the steep increase I was showing you above. It’s all about supply and demand! Even in 2006 we didn’t catch a win and that’s when it started slowing and we had lots of inventory. Can you even imagine 10.4 months of inventory, like we had in 2008?
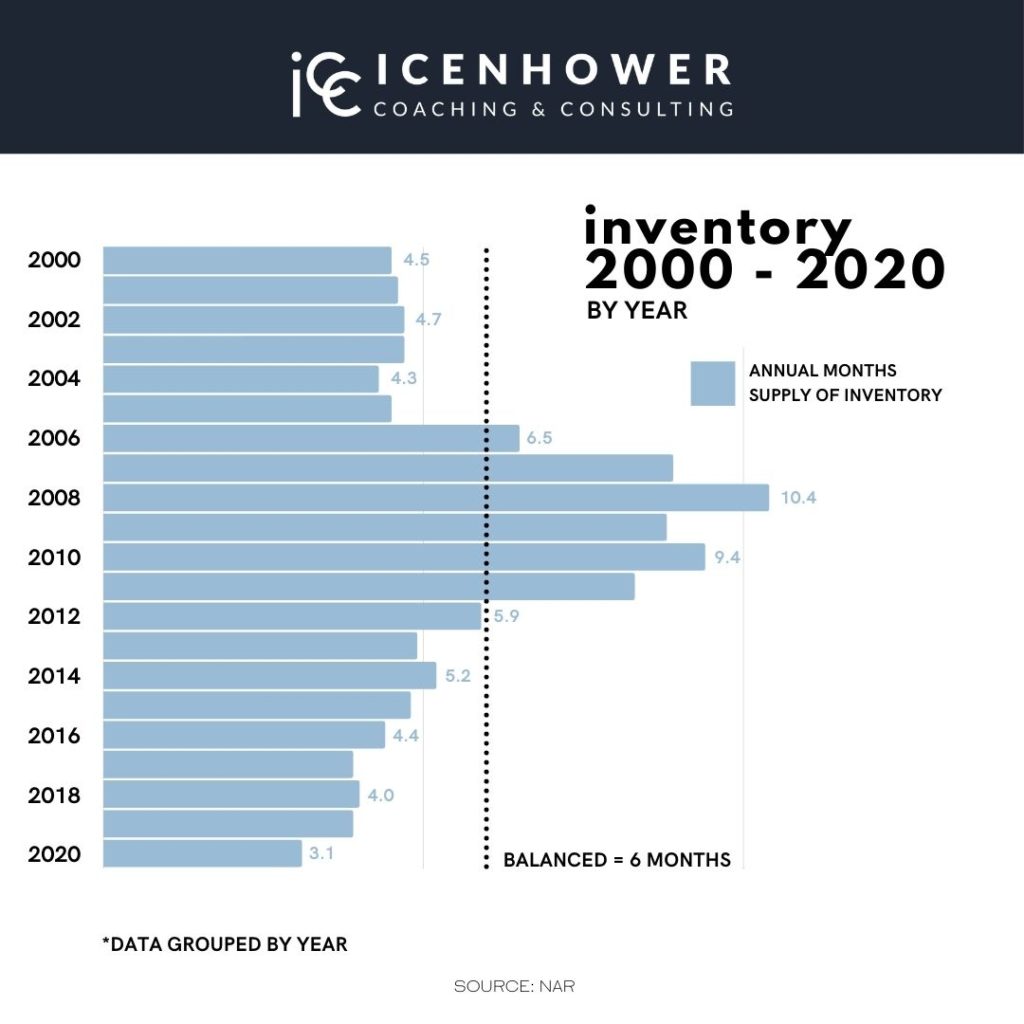
If you got your real estate license after 2008, you’ve had nothing but a seller’s market. You’ve had the best market in the history of the United States. Prices have only gone up. I’ve never seen anything like this for 12 years, that steep of a climb. Inventory has been dropping. Look where we were last year and the year before! All of those years were even better than the housing boom! Fewer homes in the market reduces supply, which means prices go up. And remember, nothing trumps supply and demand. I don’t care about politics. I don’t care about interest rates. If we have low supply, that trumps everything.
Likely, our inventory is only going to get lower. You don’t need a 2021 real estate market forecast to tell you that! We can’t build houses fast enough. COVID actually stopped the supply chain, so we couldn’t even build. We are trending in a direction that is going to take prices up much higher than they are now. In other words, we hit the boom in February of 2021. It’s going to go for at least a couple years, maybe more.
In real estate, inflation is a good thing. It just means we have a tangible asset that is going to go up in value. It’s called appreciation. It will drive the prices up more and more. The more money the government prints to stimulate the economy, the higher the housing prices will go.
Annual Appreciation of Home Prices, 2021 real estate market forecast
How much did houses, on average, across the United States, go up in value each year? You can see that even though we had that terrible housing recession from 2006-2011, it didn’t last that long. We made it back to “normal” by 2012/2013. You can see (in the graphic below) housing prices have been increasing on an average rate of about 6% from 2016-2020. But you can see in 2020 we jumped up to 9% because supply dropped too low. And this year, supply is dropping even lower so we are looking at an annual median home price appreciation projection of 10%!
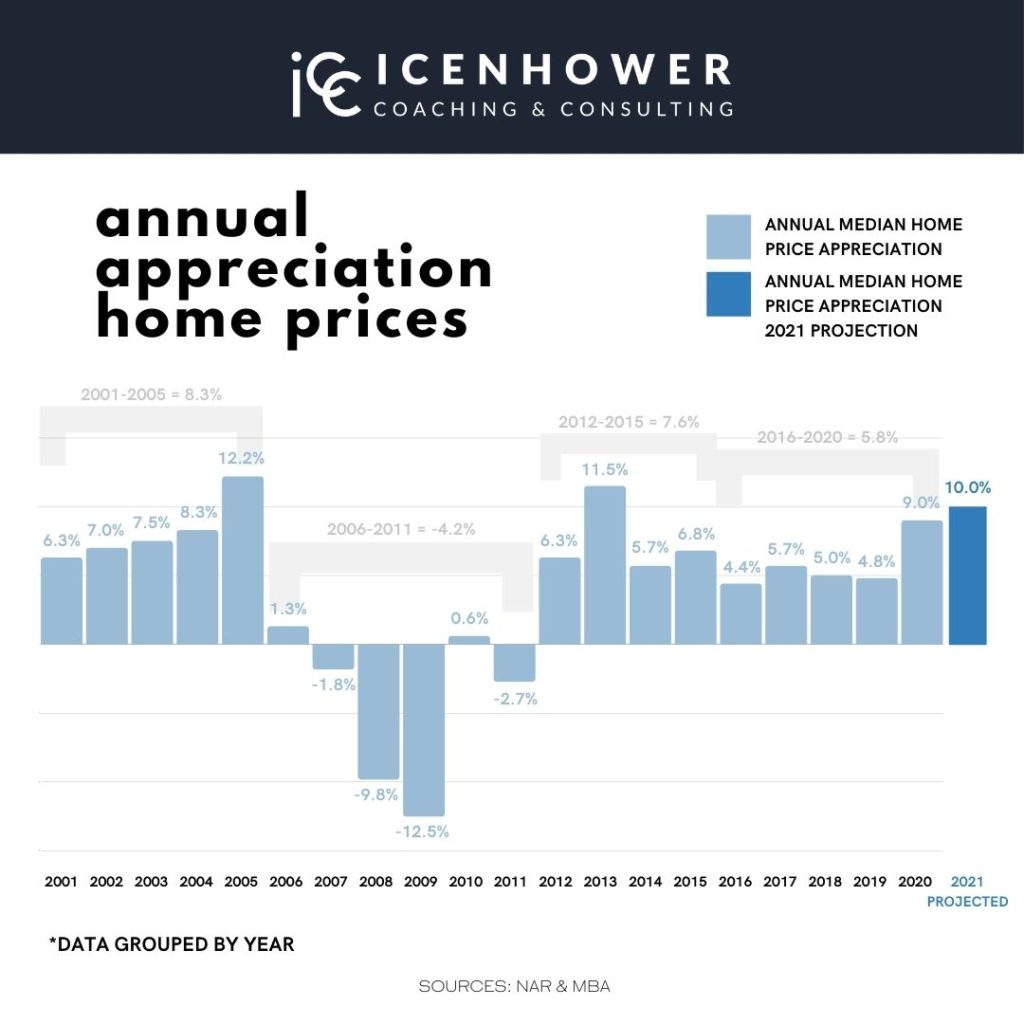
During the housing boom from 2001-2005 on the graphic above, you can see that on average, prices jumped 8.3%. Now, you can see we are trending up again. We have hit higher than the average price appreciation that we saw during the housing boom! I believe we will see a number like 13% or 14% in 2022 just because there is no way we can get enough supply in the market to meet demand.
Show this graphic to home buyers right now. If they are worried about overpaying for a home right now, tell them to just wait a month or two and their home’s value will appreciate to make up for it.
2021 Real Estate Market Forecast – Takeaways
Include these graphics in your listing presentations and your buyer presentations. Show these graphics to investors! These three graphics provide a great 2021 real estate market forecast and insight into why this market is hotter than it’s ever been. Prices are jumping right now at a rate of about 1% per month so now is the time to buy!
Need more help?
If these numbers make you dizzy, you’re not alone. Get an ICC coach in your corner to help you make sense of this crazy hot real estate market. Reach out for your free coaching consultation today.
Check out our latest posts:
- Your CRM Holds the Next 6 Months of Your Real Estate Income — Here’s How AI Unlocks It
- How to Determine the Best Real Estate Agent Lead Generation Methods for Different Types of Agents
- How Real Estate Agents Can Finally Win With Money in 2026
- The Icenhower 2026 Real Estate Sales Outlook for Agents
- Your Real Estate Follow-Up System Isn’t Broken — It Just Doesn’t Exist (Here’s How AI Fixes It)

