
Use this US Housing Supply Shortage Graph to help clients understand how real estate supply and demand are out of balance, and how home prices are likely to continue increasing because of it.
Download, save, and share this blog’s FREE US Housing Supply Shortage Graph. Today we are going to talk about the low housing supply and the effect it will continue to have on housing prices. This will change the industry for real estate agents and how they do business.
Watch and share these talking points in this video below to help explain why rising interest rates will NOT shift the real estate market and home prices. Keep your clients in a competitive mindset and prevent them from “waiting until the market calms down.”
VIDEO: US Housing Supply Shortage Graph
Why are investors buying up homes in the U.S.?
There is an increasingly large percentage of high-volume investors who are buying up homes across the United States. If you go back 25 years, you would see that about 65% of Americans owned their own homes. Recently, it got up to about 75%. Guess where it’s headed? Way down. In all likelihood, it’s going to dip below 50%.
If you watch this fascinating segment on 60 minutes, you’ll understand why we believe demand is not going to slow down. Stay tuned for our US Housing Supply Shortage Graph for more insight.
Think about it … the American Dream is largely based around the idea of home ownership. Of course, it’s a dream – not everybody will achieve it. Investors understand that. They also know that although everyone needs a roof over their heads, not everyone can afford to own that roof.
This is why all the big hedge funds, investment trusts, flippers, and corporations are now buying up property. Rent is going through the roof and it will continue to rise.
How can prices keep going up?
Well, prices must keep going up if we don’t have enough supply. This is the general, fundamental principle of economics. Prices will go up if there is not enough supply. Demand doesn’t even really matter. It’s all about supply. If there’s not enough supply, there is money to be made. This is what’s happening.
This trend is projected to continue for years. It’s not going away anytime soon. If you take a look at our US Housing Supply Shortage Graphs, you’ll get a glimpse at the numbers that back this up.
US Housing Supply Shortage Graph and other great infographics
In the video that accompanies this blog post, I show several powerful graphs. Data should guide your decisions, as well as how you educate your clients.
Here are a few of the most impactful US housing supply shortage graphs that I shared, and why they’re important.
Median Sales Price of Houses Sold infographic
You can see that prices have always increased. With a few corrections here and there, real estate prices continue to climb. If you can hang on a bit, even through recessions, prices will always continue to go up. If you look at this chart, it’s hard to argue that prices will be going down anytime soon. It is historically proven that if you hold on long enough, you will always get your money back through your equity.
Average 30-Year Mortgage Rates infographic
Look at where the average 30-year mortgage rates were in the 1980s. They peaked around 18%! And yet, prices continued to increase.
Mortgage rates are not tied to the government. A lot of Realtors do not understand this, but these rates are tied directly to an open market economy. No one is “raising the mortgage rate.” Yes, there are things that the government can do to affect the economy. But nothing can be done directly to the mortgage rate. In fact, it is in the government’s best interest to keep the rates low. Why? Because politicians want to get re-elected.
Why is it important that mortgage rates stay low? Because there is a home-ownership problem. People can’t afford houses otherwise. It’s bad for the economy for rates to go too high while prices continue to skyrocket.
Yes, rates may go up. It might finally happen. If they do, that doesn’t mean that housing prices will be affected. Housing prices will continue to rise. All this will do is drive investors to buy even more.
Here’s a quick recap of what we’ve covered so far
- Low supply means prices will continue to rise
- Don’t be surprised if the rates don’t go up
- High prices have never stopped buyer demand
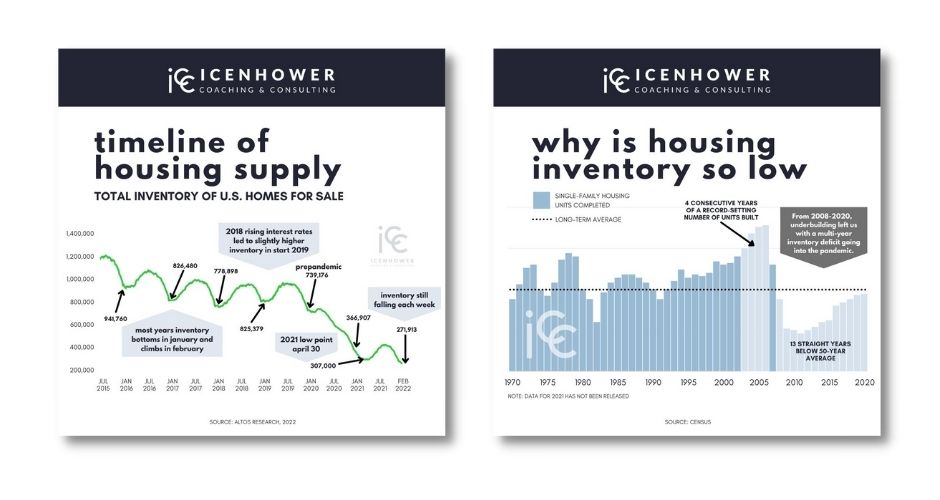
Timeline of Housing Supply infographic
We are slowly running out of inventory as the population increases, and we’re not building enough new homes. All of a sudden, we see a small bump in interest rates – but it didn’t do too much. In 2018, inventory was slightly higher but prices kept going up. The pandemic hit and inventory fell further. Even after a significant lightening of pandemic restrictions, inventory continues to fall to this day. This graph speaks in a big way to the US housing supply shortage.
Why is Housing Inventory So Low infographic
This graph uses data going back to 1970 to show how many new homes were built each year. In the 1990s we started to build more houses. In the early 2000s, we built a record number of homes. For the first time in a long time, the market was oversupplied. You can then see where the recession hit. Ever since the recession, fewer homes are built each year! This made us very far behind in housing supply.
Homes Built vs. Population Growth
This graph shows homes built (in millions) next to population growth (in millions) over decades. Going back to the Great Depression, you can see that this was the last time we built such a low number of houses. As time went on, homes built was pretty close to the population growth numbers. When the recession happened in the 2000s, home building slowed to a crawl. Now we have a huge disparity.
Fun fact: interest rates can actually perpetuate prices to go up even faster.
Here’s why supply will remain low. We’re still building at a rate that is below that national average. We are getting further and further behind — we are not catching up. To even attempt to catch up, people must buy land, get it subdivided and approved my city governments, get streets poured, electrical companies involved, etc. There is so much to do. And, the builders need the courage. There are not many people with the courage to stick their neck out and do all this.
US Housing Supply Shortage Graph: houses won’t just appear out of nowhere
It takes time to build up the housing supply. We will see it coming before it happens. It certainly won’t sneak up on us. The notion of the market “crashing” overnight is preposterous. Yes, it will happen someday! But we will see it coming. And it will take time.
This is why the “smart money” (investors, hedge funds, corporations) are buying up houses as fast as they can. They know it will be a while before things change, so they are putting their money in the smartest place.
People who don’t know about economics and don’t understand these US housing supply shortage graphs are the “dumb money.” They are missing out on the opportunity because they think the market will crash any day now. They are frozen and they are losing out as a result.
This is why you must pay attention to these graphs. Follow the economics of it. This knowledge will give you power as a Realtor. You can anticipate what will happen down the road, so you can better educate your clients. You won’t feed into the misinformation.
FREE DOWNLOAD: US Housing Supply Shortage Graphs
Get a FREE DOWNLOAD of two of our US Housing Supply Shortage graphs. Save these high-resolution graphics and share with your clients. Through sharing this data, you can handle urgency objections and combat misinformation in relation to the housing market.
Want to learn more?
- Read The High-Performing Real Estate Team. You can buy Brian Icenhower’s best-selling book on Amazon.
- Subscribe to The Real Estate Trainer Podcast. You can find it on Apple Podcasts, Google Podcasts, Spotify, Podbean, and anywhere you listen to your favorite podcasts.
- Join the Real Estate Agent Round Table. We are always posting fresh content – everything from market updates to free templates – and host dynamic discussions with the industry’s top producers.
- Subscribe to our newsletter. In the sidebar of this blog, you’ll see a subscription sign-up form. You’ll be the first to find out about our new resources, free downloads, premium online courses, and the promotions.
- Reach out and talk to an ICC coach. Not sure which of our coaching programs is right for you? Let us help you.