-
Quick View
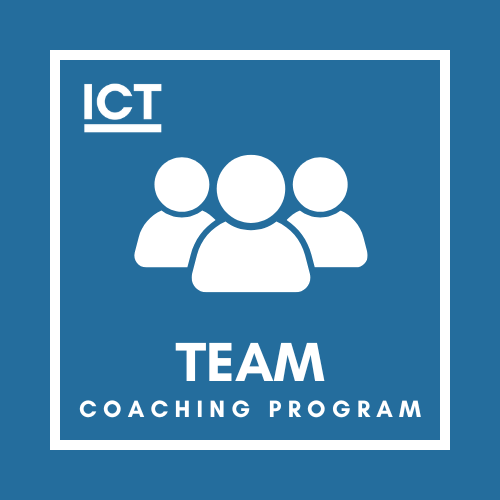
Team Coaching Program
The Team Real Estate Coaching Program is for smaller teams looking for internal structure, leverage and leadership.
-
Quick View
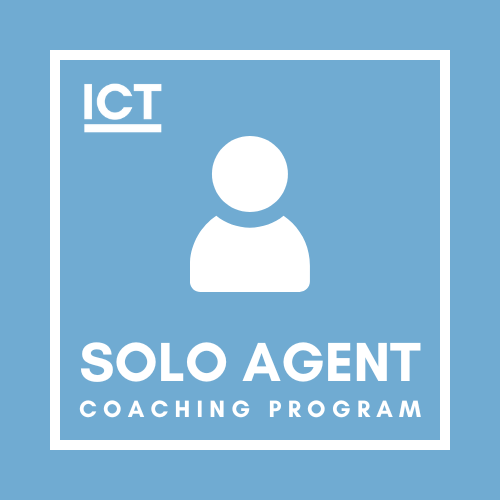
1×1 Solo Agent Weekly Coaching Program
This 1×1 Solo Agent Weekly Real Estate Coaching Program designed to help you increase your production and your commission income with strategies and systems for sustainable business growth.